Chart
The Chart is a sophisticated control used to embed graphs into your report. To add this control to the report, drag it from the Report Controls Toolbox tab and drop it onto the report.

A chart contains various visual elements (such as diagrams, series, legends, primary and secondary axes, titles and labels). You can select these elements in the Report Designer and customize their settings in the Property Grid.
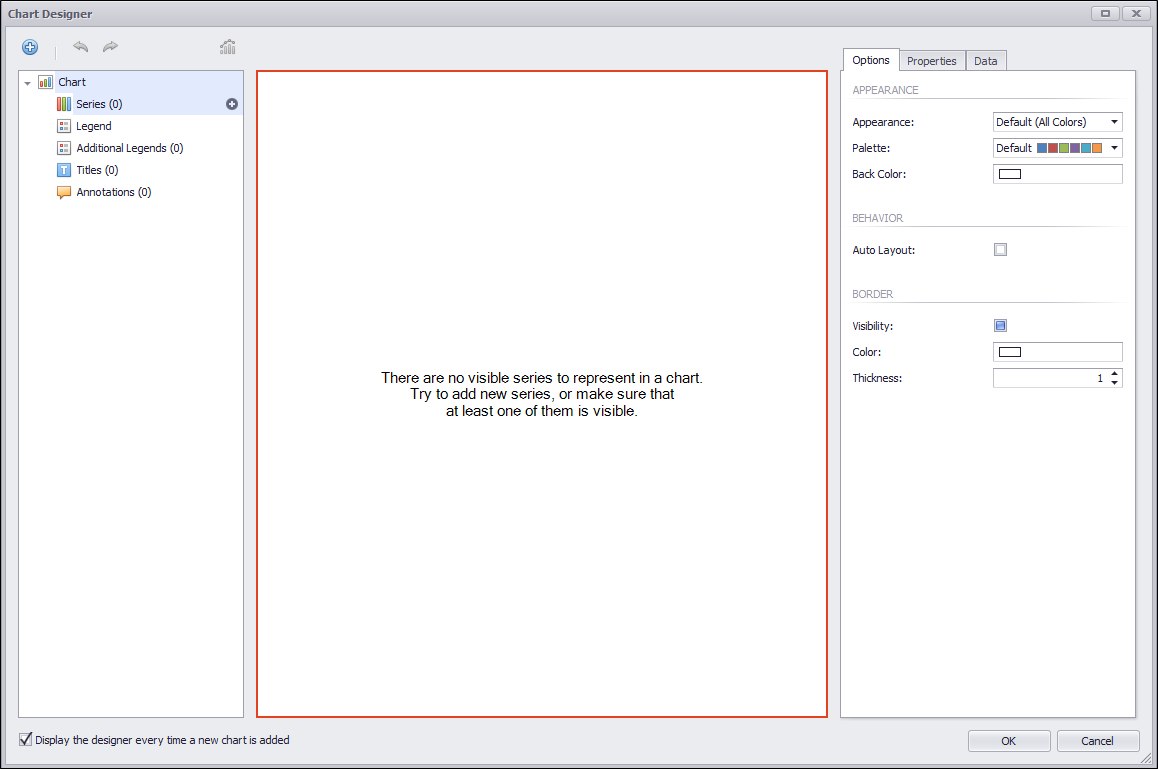
Chart Designer
The Chart Designer enables you to quickly create and customize charts.
Bind a Chart to Data
When the chart data source is not assigned, the chart obtains data from the report's data source.